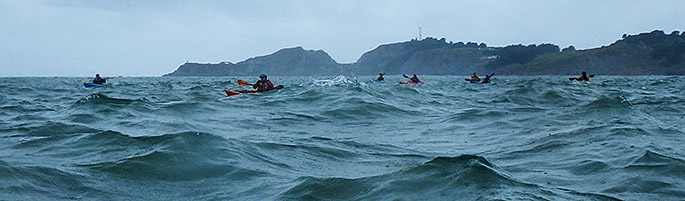
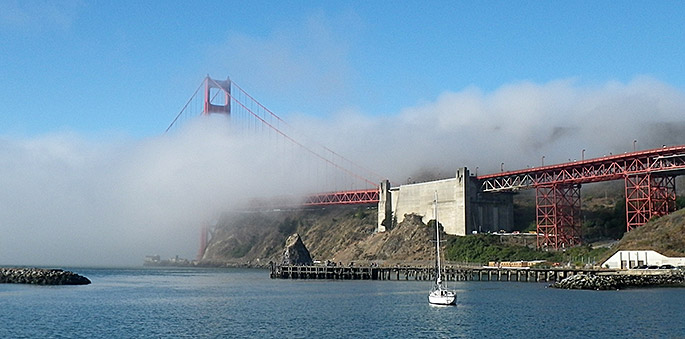
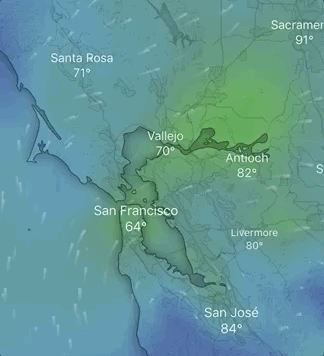
San Francisco Bay area weather is famous for changing quickly. One area may have gusty winds while the rest of the bay has moderate breezes. When wind funneling through the Golden Gate opposes an ebb tide, it can create steep, chaotic waves that require advanced paddling skills. In the summer, fog banks rolling through the Golden Gate can spread over large areas fast—faster than you can paddle. Northwest winds often strengthen drastically in the afternoon, making the paddle back to your put‑in a challenge.
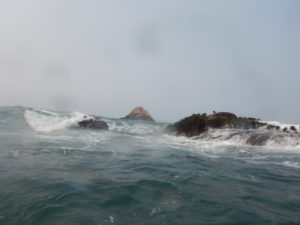
Outside the Gate, and particularly on the open coast, ocean swell—and the surf it creates—are also key concerns.
Always check the weather forecast before putting in, even if you checked it the night before, and don’t be surprised if actual conditions are different than forecast. If you will be going out the Gate or on the open coast, check swell and surf forecasts as well. (Swell is easier to predict than weather; forecasts for the height and direction of ocean swells are fairly reliable.) Be prepared with a fallback plan in case conditions are worse than expected. You may want a fall‑forward plan as well, in case they are better than expected!
How to Check the Marine Weather Forecast
A marine weather forecast differs from a land forecast; it emphasizes wind, waves, swell, and fog, and it provides warnings such as Small Craft Advisories.
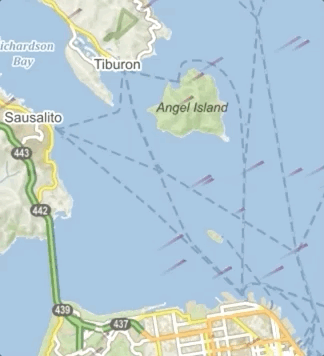
The NOAA provides both point forecasts (which apply to a small area) and zone forecasts (which apply to a large area). For kayakers, point forecasts are usually more relevant. Here’s an example of a point forecast area versus the corresponding zone forecast area:
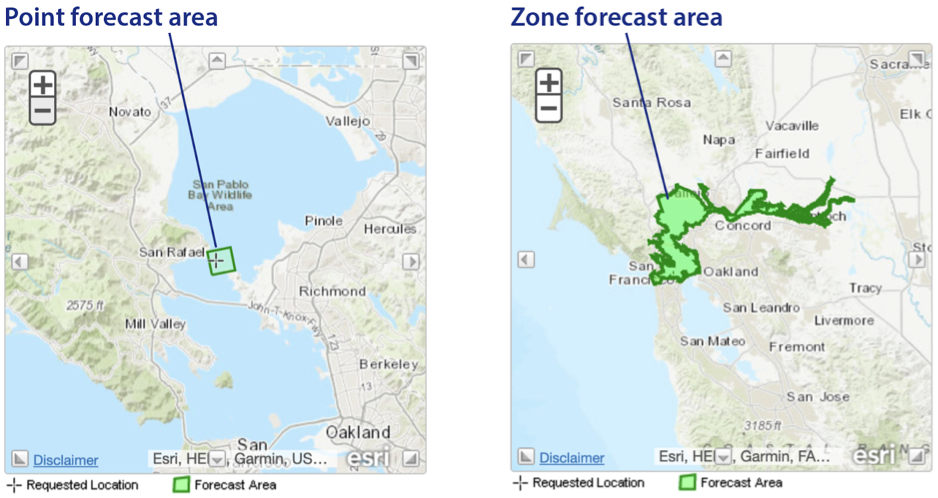
One way to check the NOAA marine forecast is via the National Weather Service, weather.gov. After zeroing in on the general area you want via the map or the city/ZIP code search box, click or tap on the exact area where you will be paddling. If you click on water, you get a marine point forecast. The weather.gov page also gives a link to the corresponding zone forecast.
The hourly weather graph. If you scroll down in the browser interface for a marine point forecast (or click on “Additional Forecasts and Information” on your phone), you’ll find the useful Hourly Weather Graph, which gives hour-by-hour forecasts for wind, swell, and wind waves.
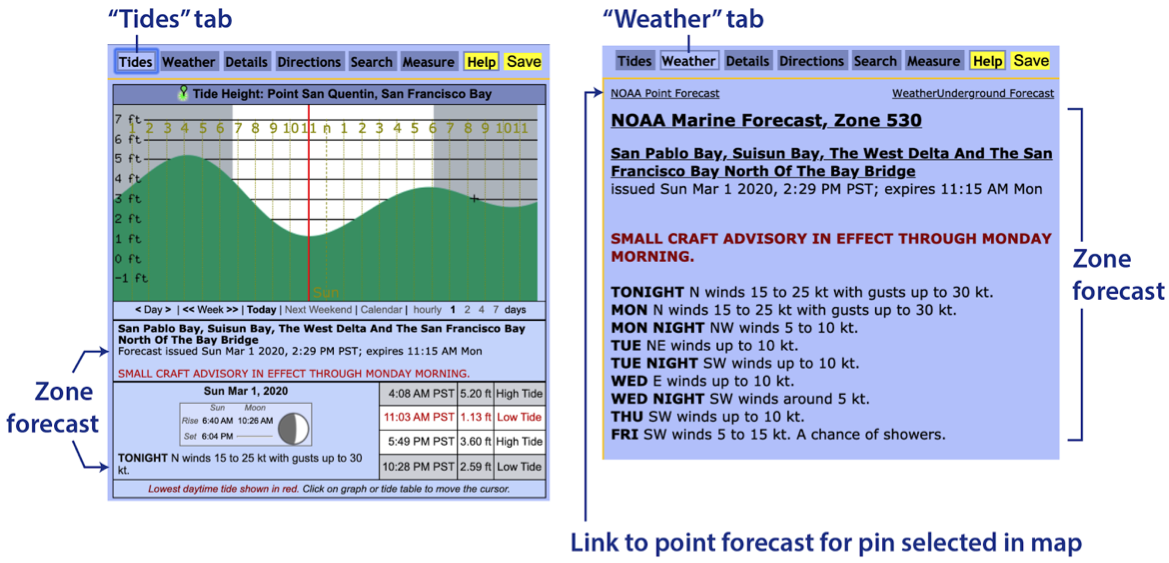
Weather on the Trip Planner. The Tides and Weather tabs on the Trip Planner show the zone forecast. The Weather tab also has a link to the point forecast for the pin selected on the map:
Windy gives the big picture for wind. The app and website Windy (windy.com) give a visualization of what the winds are doing on large and local scales, along with a forecasting slider. Unlike a NOAA forecast, it lets you see the whole pattern, helping you to understand and predict local conditions.
How to Check Swell and Surf Forecasts
If you’re heading out the Gate or onto the open coast, you should check the swell forecast as well as the weather forecast. Some useful sources of information are the NOAA marine forecast (which lists swell where applicable), surf forecasts for relevant beaches, ocean swell models, and data buoys. Local knowledge is also valuable, and ultimately you will use your own eyes.
- Surf forecasts for specific beaches: Often, the best way to get a sense for ocean conditions where you will be paddling is to look at the surf forecast for nearby beaches that have a similar exposure (for instance, west-facing or south-facing). Beaches that are frequented by board surfers have such forecasts, typically by Magic Seaweed, Willyweather, Surfline, or Solspot. Just search on the beach name and “surf forecast.” Three examples:
Magic Seaweed—Bolinas
Willyweather—Rodeo Beach
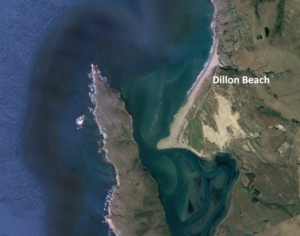
Surfline—Dillon Beach
Magic Seaweed also offers charts for specific parts of the coast, such as its Marin County forecast.
These forecasts give information on both the nearshore swell and the actual surf at the beach. The surf per se matters if you will be launching or landing from that beach. See more information below on how to interpret surf and swell forecasts. - Ocean swell models: These models, such as the Magic Seaweed North Pacific Swell chart and the Coastal Data Information Program California Wave Model, provide a picture of the swell over a broad area and give context for what will happen near the shore.
- Data buoys: If you want to know what is actually happening out to sea, you can use the National Data Buoy Center to check the buoys that feed information into the above models and forecasts.
How to Interpret Surf and Swell Forecasts
Here’s an example of conditions from the Magic Seaweed Marin County forecast:
Primary versus secondary swells: Swells originate where storm winds blow over the open ocean, and they can travel for thousands of miles, gradually losing height. Thus, a forecast will often list two or three swells. In the winter in our area, the primary (most prominent) swell often originates from somewhere in the North Pacific and thus has a westerly or northwesterly direction; there may also be a secondary southerly swell coming up from below the equator.
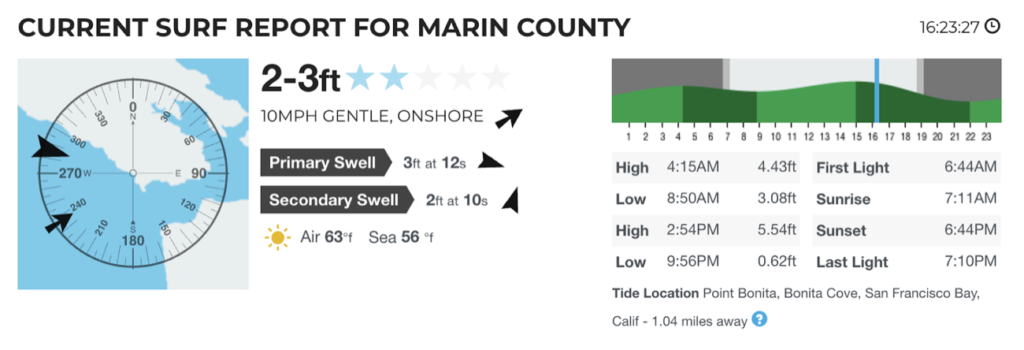
A secondary swell may not be noticeable on its own, but it will tend to accentuate sets (that is, it will tend to accentuate the difference between large sets of relatively large waves and small sets where the waves become small).
Swell height, period, and direction: The height of a swell is the height from trough to crest; the period is the time (in seconds) between successive crests or troughs, and the direction is the direction from which the swell comes. Let’s unpack a little:
- Wave height: The “height” of a swell is actually the significant wave height, which is the average height of the largest one-third of the waves. This means that individual waves may be smaller or larger than the listed “height.” On average, in fact, one in every 100 waves will be half again as large, one in every 1,000 waves will be twice as large, and occasional waves will be even larger. In the course of a typical open-coast paddle, you will see these larger waves.
- Wave period: When a swell interacts with the shore, the wave period matters more than the wave height. The longer a wave’s period, the greater the mass of water it packs, and the faster it moves. This mass and energy add up to bigger surf. A 3-ft swell at 8 seconds is not especially scary; a 3-ft swell at 18 seconds is a different beast entirely.
- Wave direction: A given beach or stretch of coastline may be sheltered from some directions and exposed to others. Dillon Beach, for instance, faces west; it is exposed to west and northwest swells, but relatively protected from southerly ones by the Pt. Reyes peninsula.
Tide: On the open coast, the tide determines the depth of water that covers undersea rocks and reefs and can change the way surf behaves on a beach. For example, a swell that does not break on the reef south of Pillar Point at high tide may break there on a lower tide; and a beach that is shallow, with spilling surf, at low water may be steeper and dumpier at a higher tide.
Links
- Former BASKer Storm Steiger has a page with SF Bay weather tips, discussing and explaining seasonal and daily weather patterns.